


The SOL coin is now in a retracement phase which has pushed the price of the coin to the $184 support level. The coin is moving around this level, as it aims to have support for the rally. But the price action is still in need of more data if a bullish reversal is to take place; otherwise, what was supposed to be a short-term fall would continue.
The SOL coin daily RSI chart shows an important drop for a minor pullback. The intraday trading volume in the SOL coin sits at $1.47 billion, which shows a loss of 23.63%.

SOL/USD 4-hour Time Frame Chart
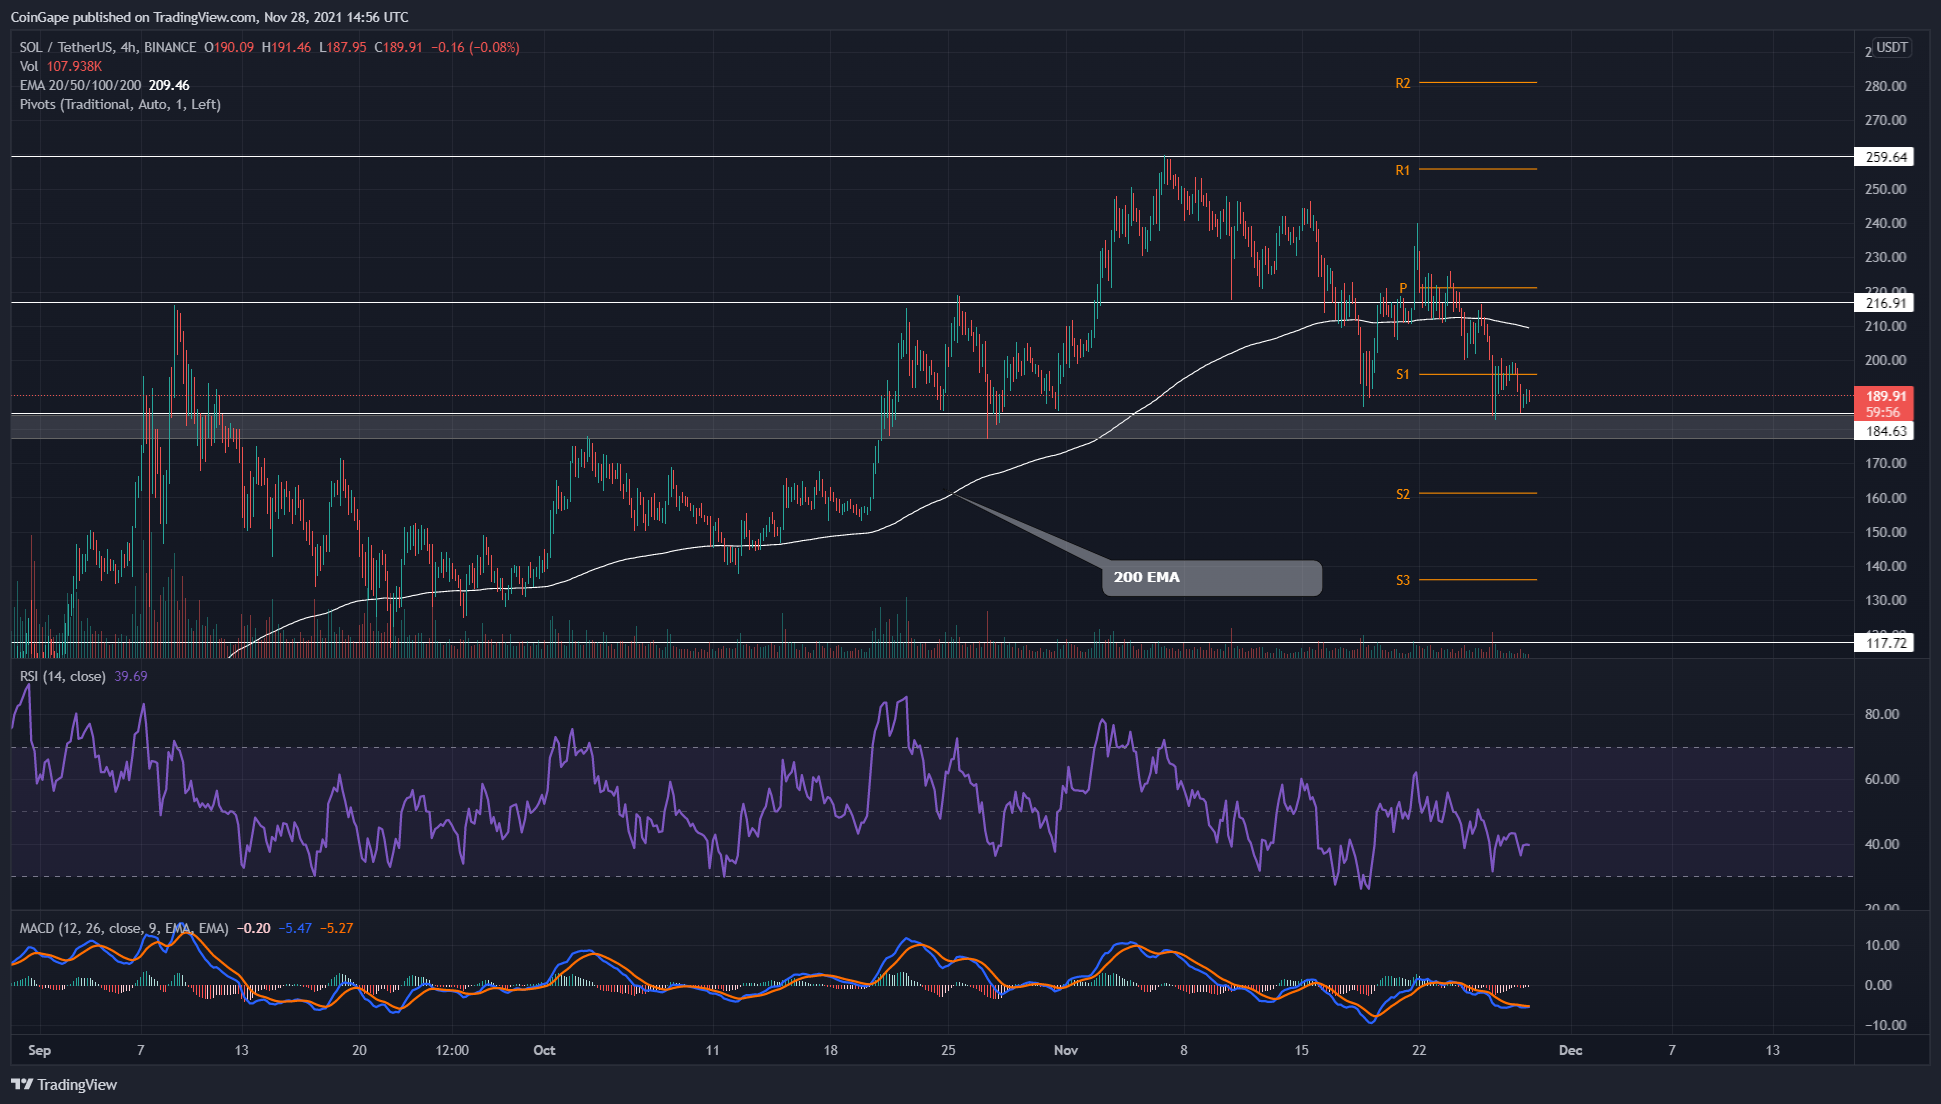
SOL is now trading at the $189 level, with an intraday loss of $1.51%. The RSI chart in the above chart shows an obvious bullish divergence, which indicates a growing bullish momentum at this support.
Then again, the price action hasn’t shown sufficient demand pressure for this support level, which means that crypto traders may wait until the price goes for the nearest resistance level, at $217, offering a better confirmation for a bull rally.